Financial Highlights
As of March 31, 2021
|
The 57th fiscal year (March 2017) |
The 58th fiscal year
(March 2018) |
The 59th fiscal year
(March 2019) |
The 60th fiscal year
(March 2020) |
The 61th fiscal year
(March 2021) |
|
|---|---|---|---|---|---|
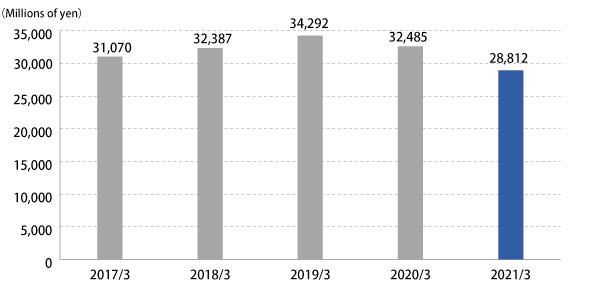
| Net sales (Millions of yen) | 31,070 | 32,387 | 34,292 | 32,485 | 28,812 |
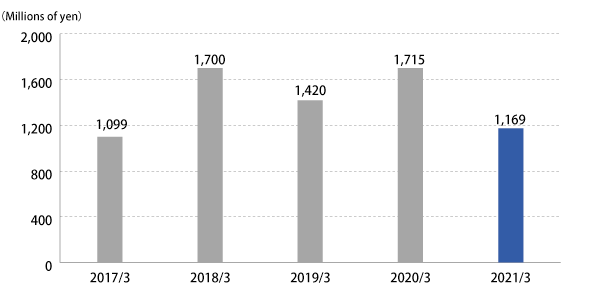
| Operating income (Millions of yen) | 1,099 | 1,700 | 1,420 | 1,715 | 1,169 |
|
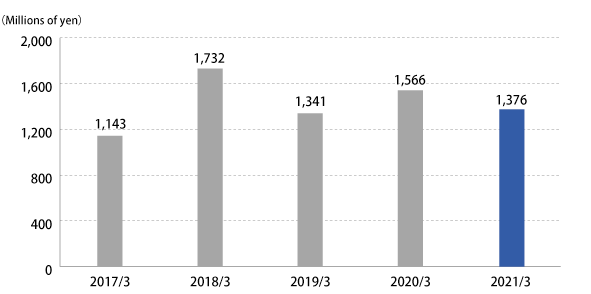
Income before income taxes |
1,143 | 1,732 | 1,341 | 1,566 | 1,376 |
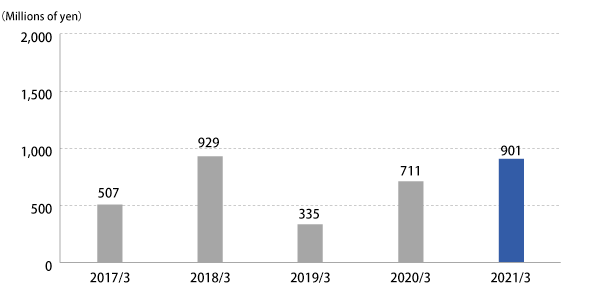
| Net income (Millions of yen) | 507 | 929 | 335 | 711 | 901 |
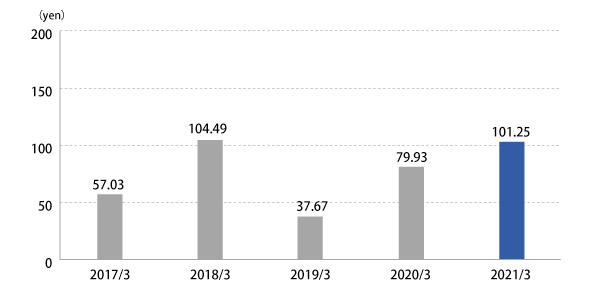
| Net income per share (Yen) | 57.03 | 104.49 | 37.67 | 79.93 | 101.25 |
Net sales
Operating income
Income before income taxes
Net income
Net income per share